We trained AI on 5 years of call report data across 4,015 credit unions. Four metrics consistently separate fast growers from slow growers.

Discover how automation can be a powerful ally in achieving and maintaining HIPAA compliance, reducing risks and administrative burdens for healthcare organizations.

An AI analysis of the financial ratios and metrics of high growth credit unions, based on XGBoost trained on of 5 years of quarterly call report data

We trained AI on 5 years of call report data across 4,015 credit unions. Four metrics consistently separate fast growers from slow growers.
An AI analysis of the financial ratios and metrics of high growth credit unions, based on XGBoost trained on of 5 years of quarterly call report data

The Dangerous Myth in Peer Benchmarking

Mostpeer benchmarking quietly assumes:

“What works for a $400M credit union should basically work for a $2B credit union.”

Our data says that’s wrong.

We trained a AI Models (XGBoost classification models) on five years of quarterly NCUA call report data, segmenting credit unions into three asset tiers and comparing:

  • Fast growers: >6% annual asset growth
  • Slow growers: <3% annual asset growth

Across cohorts, our models were able to predict whether a credit union was a Fast Growing Credit Union, vs Slow Growing with a 74%-81% accuracy, with only looking at their financial ratios & metrics.

Finding 1: Different Scale, Different Growth Drivers

Here are the top three drivers of growth by tier, ranked by feature importance (share of total model gain):

Rank Under $500M $500M – $1B $1B+
#1 Accounts per Member (6.9%) Efficiency Ratio (8.3%) Noninterest Income Ratio (10.4%)
#2 Noninterest Income Ratio (6.6%) Cost per Member (8.2%) Members YoY (9.5%)
#3 Members YoY (6.5%) Noninterest Income Ratio (7.6%) Efficiency Ratio (6.9%)

Same industry. Same regulator. Completely different recipes.

Fast growing Credit Unions have on average a 3-5% higher NonInterest Income Share than slow growing peers

Under $500M: The Relationship‑Depth Game

Under $500M in total assets, fast growers win on:

  • Accounts per Member: more products per member
  • Year-on-year membership growth (Members YoY): higher net member growth
  • Noninterest Income Ratio: more fee and interchange income as a share of total

At this size, you don't win by out-spending anyone, you win by:

  • Members on average getting more shares and loans
  • Acquiring and retaining net new members consistently
  • Monetizing engagement through usage-driven noninterest income

If you're under $500M and your accounts per member and member YoY growth is flat, it's worth prioritizing deepening relationships with members. The credit unions with deeper relationships tended to grow faster than those with more breadth.

$500M–$1B: The Operating Leverage Game

Between $500M and $1B, the story flips. The top two drivers are:

  • Efficiency Ratio (8.3%)
  • Cost per Member (8.2%)

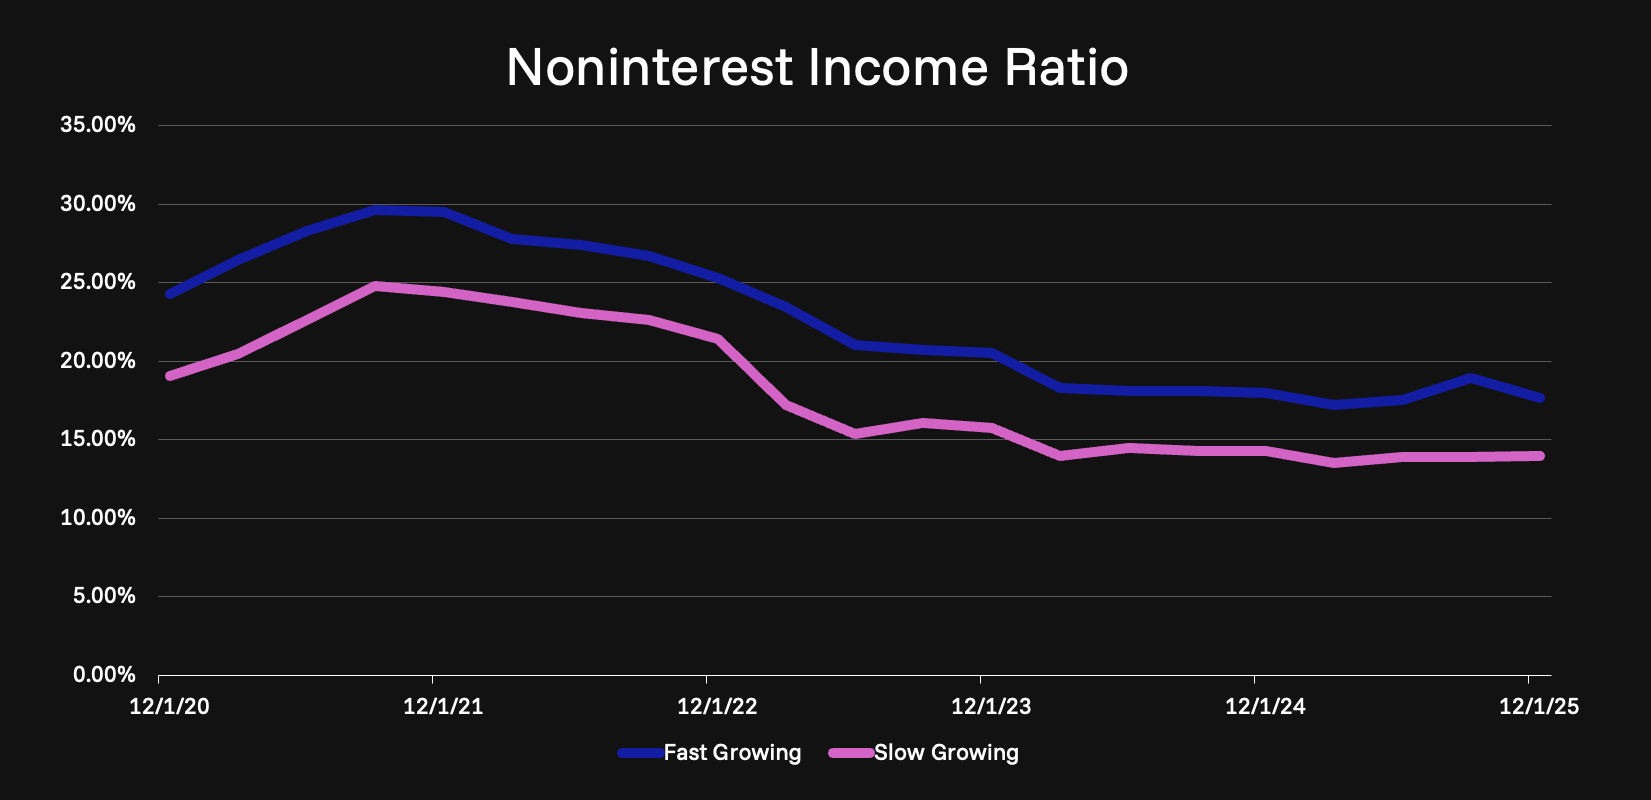
Together they account for 16.5% of total feature importance, the most concentrated signal in any model we ran. Noninterest Income Ratio is still there, but it’s downstream of cost discipline.

Fast growers in this band are not just selling more. They are:

  • Driving more revenue per dollar of operating expense
  • Reducing cost per member as they scale
  • Using that surplus to reinvest in growth

This is the make‑or‑break tier. You either convert prior relationship wins into operating leverage, or you get stuck with big‑credit‑union costs and small‑credit‑union economics.

Above $500M, slow growing credit unions have on average a $61 higher cost per member than fast growing credit unions

$1B+: The Franchise Game

At $1B and above, the mix changes again. The leading signals:

  • Noninterest Income Ratio (10.4%)
  • Year-on-year membership growth ( Members YoY) (9.5%)
  • Efficiency Ratio (6.9%)
  • Closely followed by Loans per Member and Delinquency Rate (both 6.1%)

Large fast‑growing CUs are running franchises, not just balance sheets:

  • Diversified revenue mix with strong fee/interchange contribution
  • Ongoing member acquisition at scale
  • Efficient operations
  • Tight credit risk (delinquencies contained while lending more)

At this level, growth is about orchestrating mix, cost, and credit quality, not just “more loans.”

Finding 2: Noninterest Income Is the North Star, but the Interpretation Is Subtle

Across all three asset tiers, Noninterest Income as a % of Total Income ranks in the top three. At the $1B+ tier, it is the single most important variable in the model, contributing 10.4% of total importance, nearly double the typical feature.

But the interpretation matters:

  • At smaller sizes, a strong noninterest income share typically reflects engaged members with multiple products and transaction activity.
  • At $500M+ and $1B+, the ratio competes with asset‑growth dynamics. Fast growers can deliberately see this ratio drift down as they expand interest‑earning assets faster than fee income.

So the leadership question isn’t:

“Is our noninterest income ratio high?”

It is:

“Is our noninterest income ratio where it is because we’re growing assets smartly, or because we’re failing to drive product usage and fee‑based engagement?”

Same number, two completely different diagnoses.

Finding 3: Members YoY Is the Quiet Common Thread

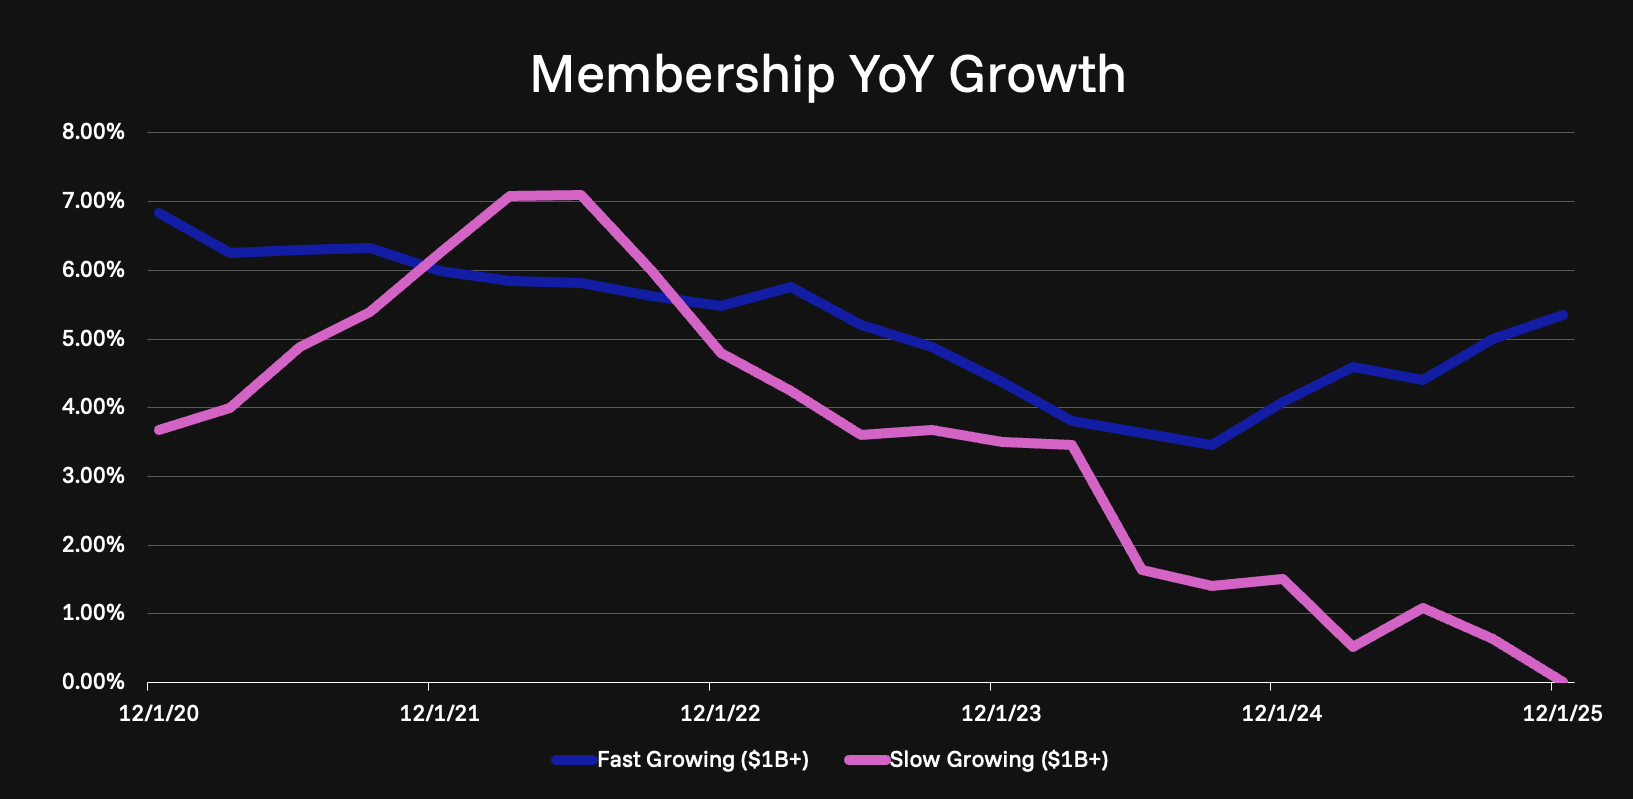
While noninterest income gets the headline, year-on-year membership growth (Members YoY) shows up near the top in every tier:

  • Under $500M: #3 (6.5%)
  • $500M–$1B: #4 (7.3%)
  • $1B+: #2 (9.5%)

Net member growth is non‑negotiable for fast growers across the industry.

Member growth is also one of the few metrics that’s almost impossible to financially engineer. You either acquired net new members this year or you didn’t. The fact that it surfaces across all three models says: organic member acquisition is a prerequisite for asset growth, not a substitute for it.

A growth gap has opened between fastest growing credit unions and the slowest growing. Since 2023, it's more than doubled, from 2% to 5%

Finding 4: Growth Becomes a Cost and Risk Game as You Scale

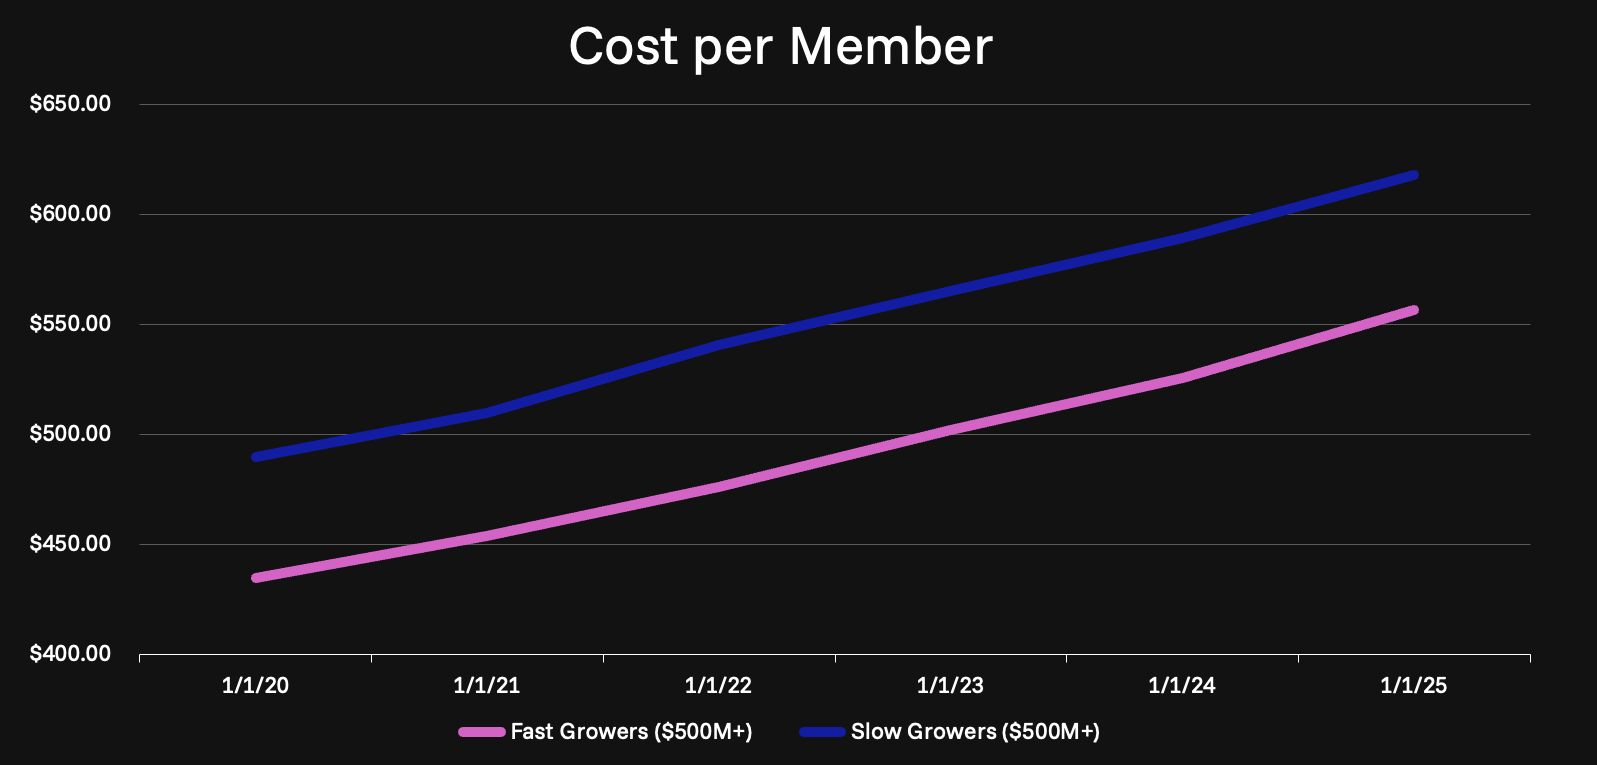
For mid‑market and large credit unions, the models are blunt:

  • Efficiency Ratio and Cost per Member separate the $500M+ winners from the rest.
  • At $1B+, Delinquency Rate jumps into the top five (6.1%), alongside Net Chargeoff Rate further down the list.

Fast‑growing larger CUs aren’t just selling more. They are:

  • Serving more members and bigger balances at lower marginal cost, and
  • Keeping credit losses under control while doing it.

That combination is what gives them the capacity to keep reinvesting in products, technology, and growth without eroding net worth.

Efficiency Ratios between fast and slow growers has diverged since 2020

Finding 5: What Doesn’t Matter (or Matters Less Than You Think)

Just as informative as the top features are the ones at the bottom. Across all three models, these consistently ranked in the bottom five:

  • Real Estate Concentration: 2.9% / 3.2% / 1.3%
  • IRA per Member: 4.0% / 2.3% / 1.8%
  • Net Income YoY: 3.1% / 3.4% / 2.7%

Two implications:

  • The Net Income YoY result is worth flagging for boards: prior‑year earnings growth is a weak predictor of asset growth. Credit unions don’t grow because they were profitable last year; they grow because of structural factors (efficiency, member relationships, product breadth). The comfortable narrative that “profitability funds growth” is only part of the story.
  • Real estate concentration being a weak signal undercuts the assumption that mortgage‑heavy CUs are the growth leaders. They aren’t, at any tier.

How to Use This on Monday Morning

Don’t overcomplicate this. Build a tier‑appropriate scorecard and plot your last 5 years against fast‑ and slow‑grower averages in your band.

If you’re under $500M, focus on:

  • Accounts per Member
  • Members YoY
  • Noninterest Income Ratio

If you’re $500M–$1B, focus on:

  • Efficiency Ratio
  • Cost per Member
  • Noninterest Income Ratio

If you’re $1B+, focus on:

  • Noninterest Income Ratio
  • Members YoY
  • Efficiency Ratio
  • Delinquency Rate / Net Chargeoff Rate

If your line looks more like the slow-grower cohort, strategic adjustments shou

Every credit union wants to grow. But what actua

wer change depending on your size?

To find out, we trained an AI model on five years of NCUA call report data across 4,015 credit unions. We asked a simple question: can we predict which credit unions will grow their assets faster than 6% annually, using only their financial ratios?

The answer was yes, with 70% to 80.6% accuracy depending on the cohort. But the more interesting finding was what the model learned along the way. The features that predict fast growth at a $200M institution are not the same features that predict fast growth at a $1B institution.

The playbook changes as you scale.

Methodology (For Your Data Team)

  • Data: 5 years of quarterly NCUA call report data
  • Cohorts:
    • Under $500M: 964 fast vs 1,901 slow
    • $500M+: 329 fast vs 209 slow
    • $1B+: 214 fast vs 118 slow
  • Models: XGBoost gradient‑boosted binary classifiers, 20 financial features (Ratios & Metrics) per CU, per quarter
  • Target: >6% vs <3% annual asset growth
  • Performance: 74.6%–80.6% validation accuracy across tiers
  • Feature importance: percentage of total model gain attributed to each feature, summed across quarterly periods

A final note on benchmarking: features that look important in industry‑wide analyses (like Share Draft Penetration) often fall to mid‑pack importance once you control for asset tier. The drivers of growth in your tier are not the drivers of growth in the tier above or below you.

Benchmark within your tier, not against the industry average. The credit unions winning the growth race are leaving a clear trail in their ratios. Your job as an executive is to decide whether you’re willing to let that trail change what you work on next.

Join the Newsletter

Get our new signals right into your email inbox. No spam, only quality content!

Thank you! Your submission has been received!
Oops! Something went wrong while submitting the form.
Get your Credit Union Growth Analysis: a 7–10 day, no‑obligation review of where you’re leaving loans and deposits on the table.
© Tudovu Inc. All rights reserved.