Easmond Tsewole
Chief Executive Officer
What 5 years of NCUA call reports reveal about how fast-growing credit unions actually built their balance sheets and what it costs the ones that didn't choose.

Credit union growth comes from two engines: how you fund the balance sheet, and how you deploy it. Certificates and primaries on one side. Autos, cards, and commercial on the other. What changes between CUs isn't the engines. It's how many they decided to actually run.
We segmented credit unions four ways on 2020–2025 NCUA call report data:
What separates them isn't size, charter type, or field of membership. It's whether they made a deliberate balance sheet choice at all.
Fast vs. slow growers, 2020–2025 CAGRs:

Certificates are the biggest gap on the funding side. Winners grew their CD portfolios at the fastest rate, compounding term funding at over 20% a year.
Share drafts tell the relationship story. Fast growers nearly doubled the growth rate of primary-transaction accounts.
Money market and IRA also show interesting divergences, growth for fast growers, flat to negative for slow growers. Slow growers are losing long-duration relationship money.
Fast growers paid for stable funding and primaries because they had somewhere productive to put it.

New auto is the starkest data point in the entire table. Slow growers shrank their new auto book while fast growers compounded it at 6.4%.
Fast growers stacked volume in autos and cards. Common yield-rich products.They layered in business and non-standard RE where spreads are wider. They used that engine to justify aggressively buying CDs and primaries on the funding side.
Slow growers shrank new auto, grew used auto and cards much slower, and leaned less into business and other RE. Their mix looks like "protect the balance sheet." Fast growers' mix looks like "deploy the balance sheet."
The interesting question isn't whether the full Fast Grower playbook works, but what happens to the CUs running only half of it.
367 credit unions raised certificates aggressively without leaning into auto lending. 1,348 leaned into auto lending without aggressive certificate growth. How are they actually doing?
The asset growth chart answers it cleanly
The mixed strategies don't catch the fast growers. But they outrun the slow growers by 6 to 7 points of annual asset growth, and crucially, they're still growing while the slow grower cohort shrinks.
An interesting observation is between 2021 & 2023, when growth rates were declining across all cohorts, the auto-first group grew the slowest, with asset growth dropping to -2.5% before growing to 5.2% in 2025.
"Pick a side and you stay in the game. Pick neither and the balance sheet starts running off."
The picture that emerges from 5 years of data isn't a winners-and-losers binary. It's three tiers:

Tier 1 - Fast Growers (Both Engines):
Aggressive on funding and deployment. Certificates compounding at20%+, autos at 9%+, business and other RE at 19–22%. Asset growth re-accelerating to 11% in 2026.
Tier 2 - Single-Engine Strategies (Cert-First or Auto-First):
Committed to one side of the balance sheet with intent. Don't catch Tier 1 but consistently stay 6+ points ahead of Tier 3. Asset growth ~5–6% and stable.
Tier 3 - Slow Growers (Neither Engine):
Passive on both sides. Regular shares and CDs happen to them on the funding side. New auto book shrank over the period. Now growing at -1% the only cohort in actual asset decline.
There's one more dimension that distinguishes the two single-engine cohorts: how much room they have left.
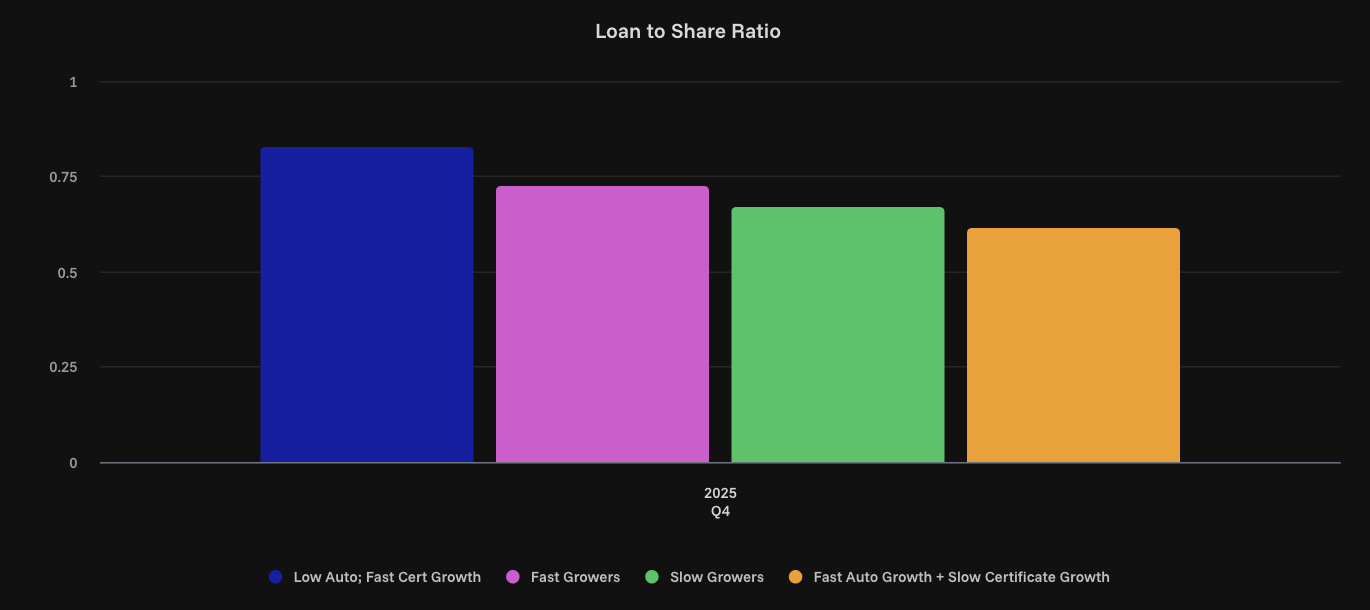
The Cert-First cohort is running a loan-to-share ratio of 0.83, the highest in the industry. They are fully deployed. There's no idle capacity left on the balance sheet. Their problem isn't that they don't have funding; it's that they've already put it all to work, mostly into mortgages. To grow from here, they have to rotate their asset books.
The Auto-First cohort is the opposite extreme, 0.62 loan-to-share, the lowest of any cohort. They've been pushing into autos but never developed the funding muscle to keep pace. They have 38 cents of every member dollar sitting in investments instead of loans. The growth runway is sitting on their balance sheet; they just haven't activated the funding side to use it.
Fast Growers sit at 0.73, deployed enough to earn, with room to grow.
Tier 2 shows two different execution strategies. To grow faster, Cert-First has to rotate. Auto-First has to fund.
There's a subtle but important divergence within Tier 2 worth flagging.
Both single-engine cohorts generate similar income today. But their trajectories are different. The Cert-First cohort is harvesting yield from as lower-growing asset base. The Auto-First cohort is reinvesting into a compounding one. Today's income looks similar. Next cycle's won't.
If you're going to commit to one engine, commit to the asset side.Funding without deployment is a sugar high. Deployment without aggressive funding still compounds.
Fast-growing credit unions didn't win by doing the same products faster. Over 5 years, they systematically shifted their balance sheets: funding growth through certificates and checking, and redeploying that funding into autos, cards, and business lending.
But the most important finding isn't about them. It's about the 2,110 credit unions doing neither, and now shrinking.
The mix changed, then the growth followed. The credit unions that didn't change their mix are now running off.
CAGR differences correlate with cohort membership — they don't prove causation. But the magnitude and consistency of the divergence across every category, over five years and a full rate cycle, strongly suggests these are deliberate portfolio choices, not byproducts.
Benchmark within your tier, then ask the harder question: is your product mix compounding the way it is because of conscious portfolio construction, or because no one ever decided to change it?
Coming next: we're running the analysis on what the next 5 years of growth looks like — which engines compound from here, and which ones stall. Subscribe to get it first.
Perspective for technical leaders navigating growth and strategy, while being secure & compliance.